World—Likely El Niño to exacerbate manifold costs of climate change
Despite the cooling effect of La Niña for the past three years, 2015-2022 were the eight warmest years on record. The global mean temperature was 1.15°C above the 1850–1900 average in 2022. Extreme weather and natural disasters affected populations worldwide; for instance, via continuous drought in East Africa, extensive flooding in Pakistan and record heatwaves in China and Europe. The World Meteorological Organization (WMO) forecasts a 98% likelihood that the next five-year period will be the warmest on record. This reflects the effects of human-induced climate change amplified by an increased risk of a naturally occurring El Niño event in coming months—which warms the Pacific Ocean’s surface. WMO scientists estimate a 66% chance that the average global surface temperature will exceed 1.5°C above pre-industrial levels in at least one year by 2027. The chance of this scenario was estimated at 48% a year ago, and close to zero in 2015.
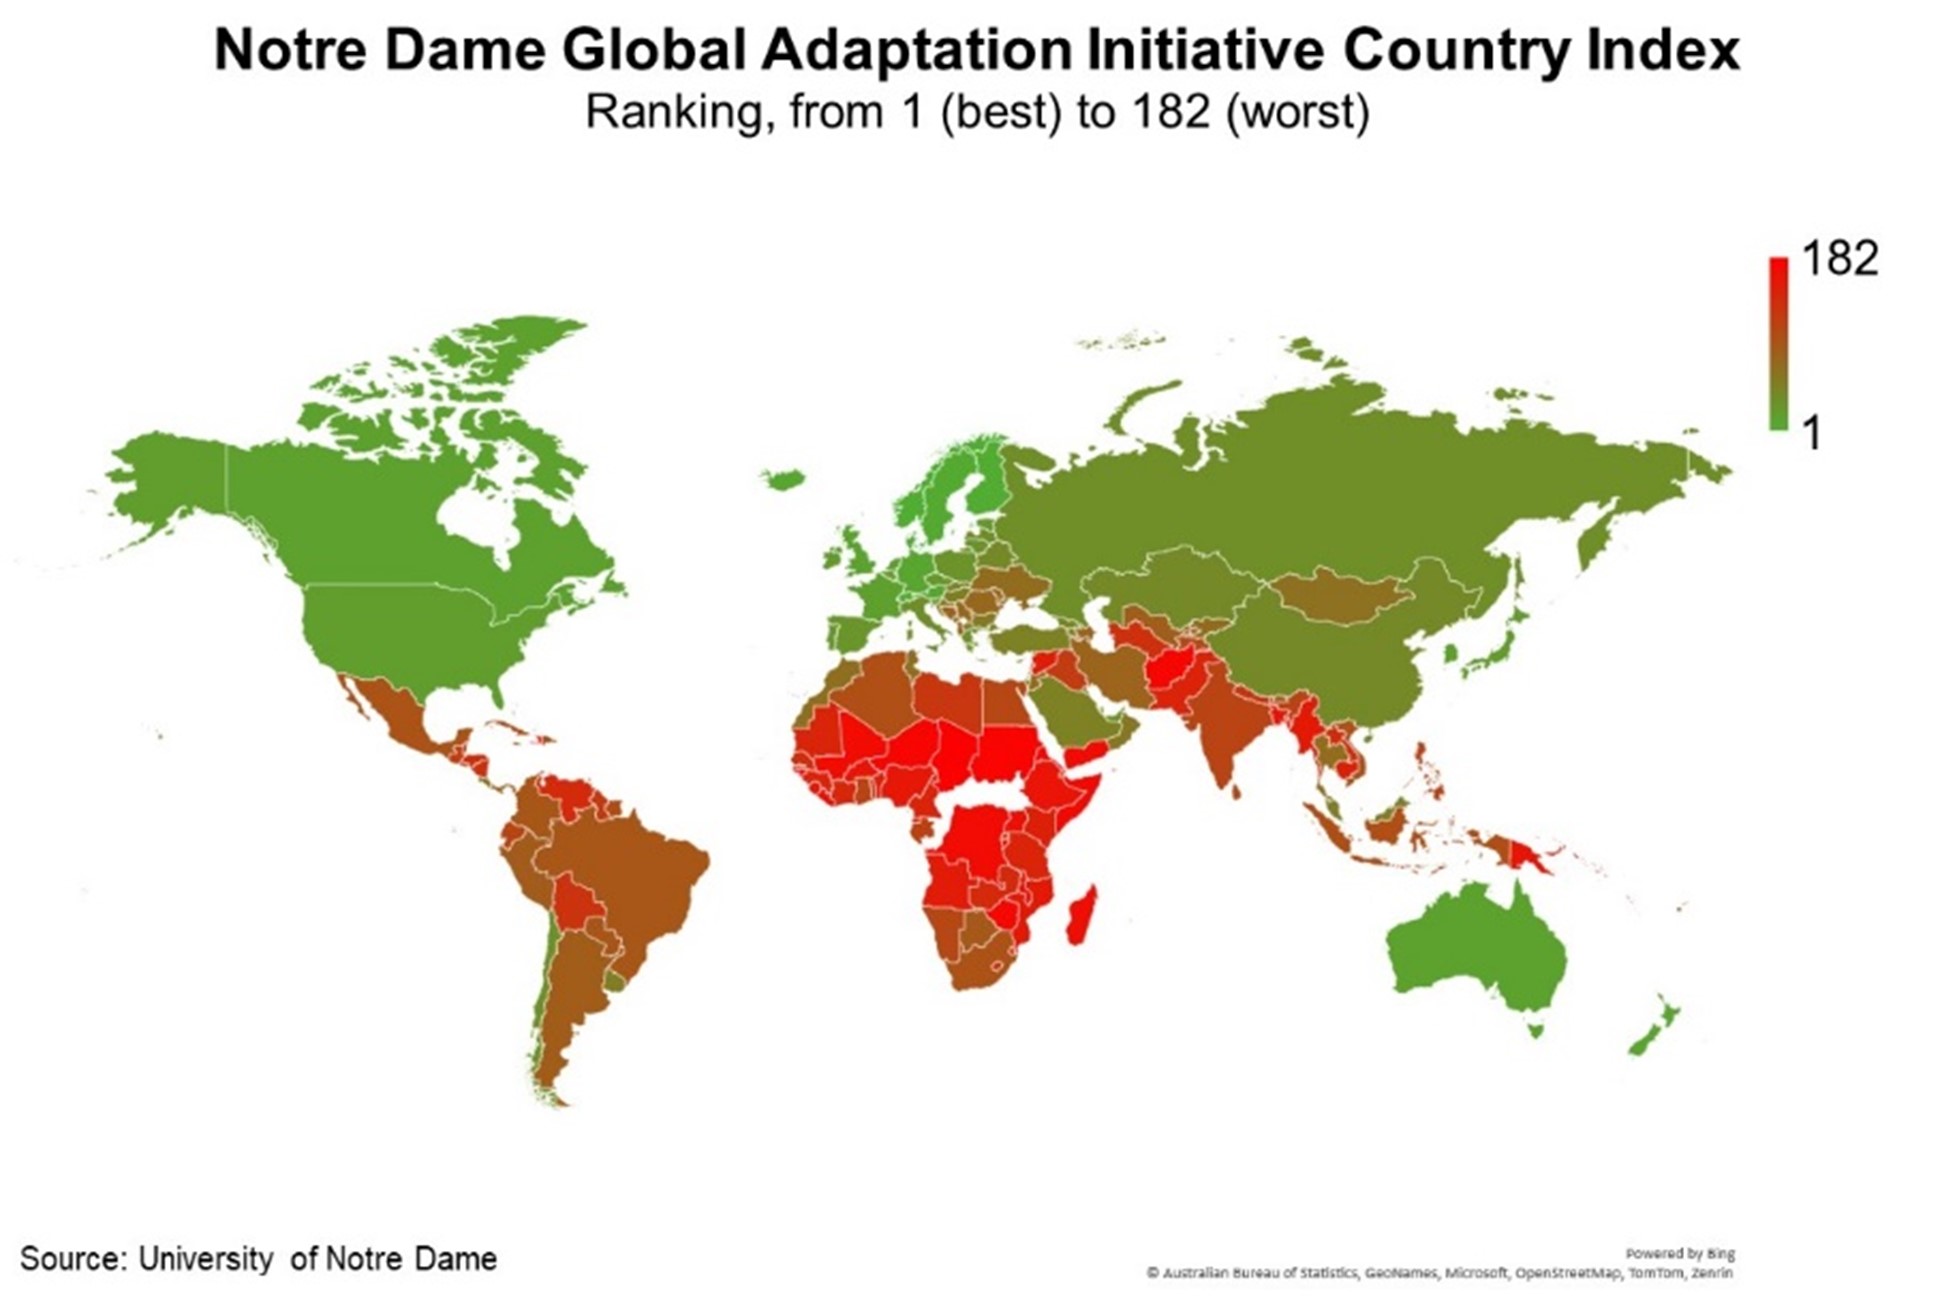
Global warming imposes enormous economic and social costs, including by increasing food insecurity, mass migration and economic and financial instability. The Notre Dame-Global Adaptation Index (ND-GAIN) Index indicates a country’s vulnerability to climate change and readiness to improve resilience (Chart). Australia ranks 13th of 182 countries, suggesting exporters are well positioned to adapt. That said, record Australian agricultural exports in FY2023 are forecast to moderate alongside warmer and drier conditions. Key export markets will also be affected, including India (111th on ND-GAIN), Vietnam (97th), Indonesia (100th), Philippines (113th) and Papua New Guinea (160th). India’s reliance on agricultural income, particularly from unirrigated areas, drives vulnerability. Meanwhile Vietnam’s extensive coastline and low-lying deltas increase susceptibility to flooding, land loss and higher soil salinity. These climate sensitivities may weigh on income growth and import demand.

